Value Verdict: Computational Risk Modeling and Inference Platform
Value Verdict is a self-initiated full-stack application designed for real-time analysis of sports market and finding positive expected value opportunities. Built with a focus on robust backend processing and interactive frontend tools, this project demonstrates implementation of advanced algorithms for data analysis, risk simulation, and real-time visualizations. The core emphasis is on technical implementation: efficient data handling, model calibration, and dynamic charting-leveraging Python for backend computations, SQL for database management, and React/TypeScript for the user interface.
Key Technical Implementations
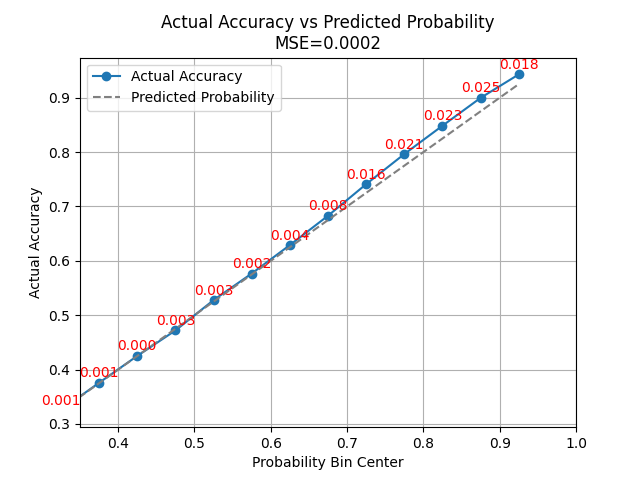
Implemented a Python pipeline to ingest and preprocess 220k+ events (odds, outcomes, history). The Shin method was integrated to infer implied probabilities and calibrated on the dataset; calibration charts were produced to validate results.
Staking and Risk Simulation Algorithms
Core backend implements Kelly criterion (with fractional variants) and large-scale Monte Carlo simulations to project bankroll growth, standard deviation, and ruin probabilities. Vectorized operations were used to scale simulations efficiently.
Interactive Dashboards and Visualizations
The frontend, built in React/TypeScript, features dynamic dashboards where users can query events and view projections. Integration between backend APIs (Flask-based) and frontend components uses hooks for state management and real-time updates. Key visualizations include:
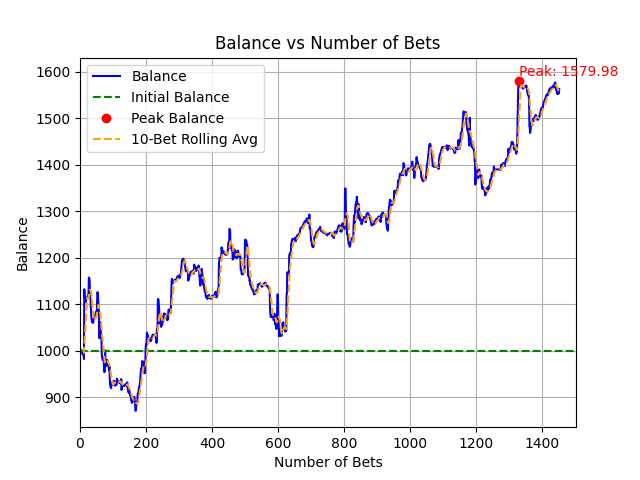
- Bankroll vs. number of bets: chart showing the bankroll as a function of the amount of bets, highlighting the growth over time.
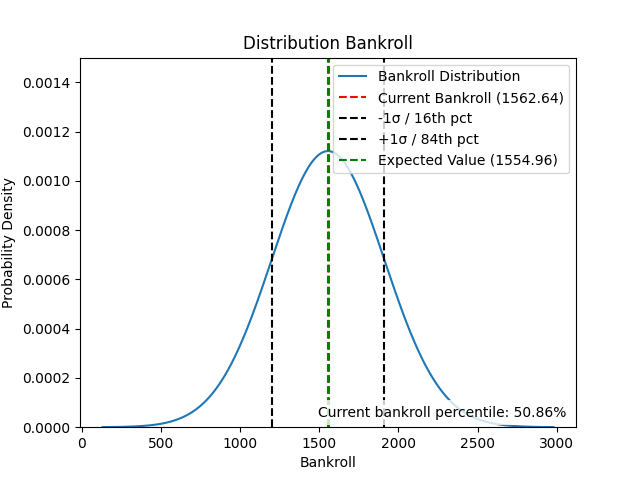
- Bell Curve of Bankroll: visualizes the current bankroll compared to the expectations.
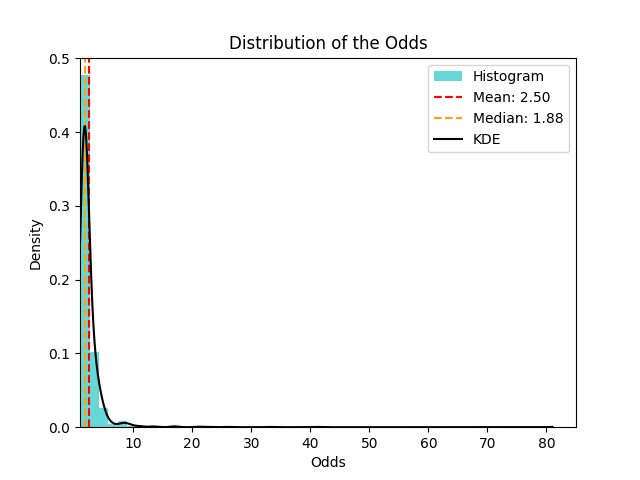
- Odds Distribution Histogram: bins odds data to reveal market biases.
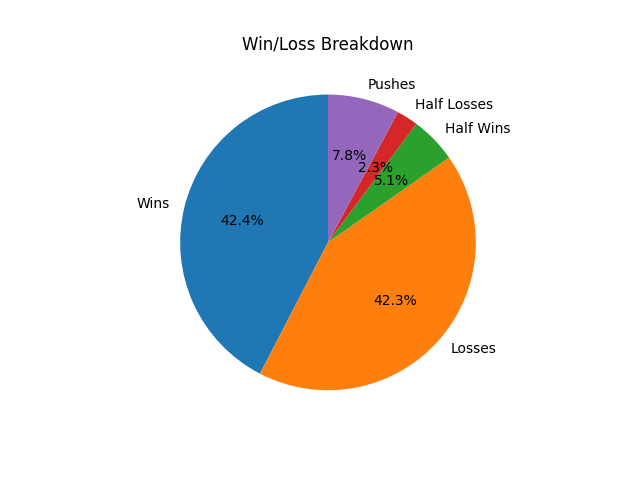
- Win-Loss Breakdown Pie Chart: outcome breakdown with percentage annotations.
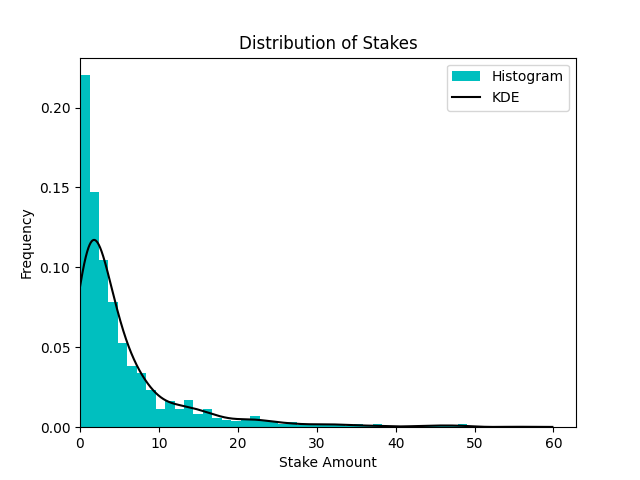
- Stakes Distribution Histogram: visualizes spread of computed stake sizes.
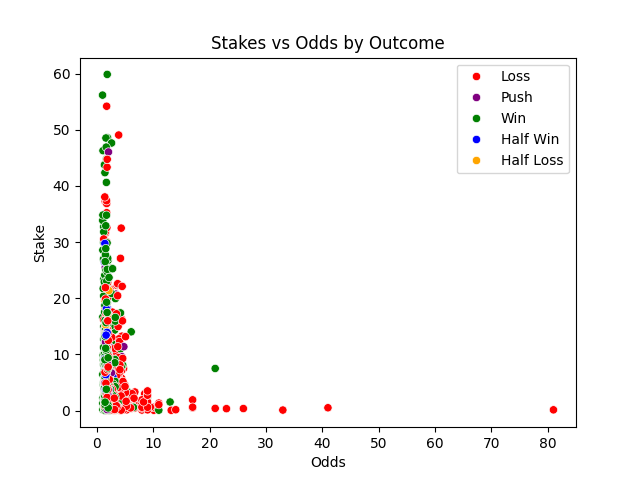
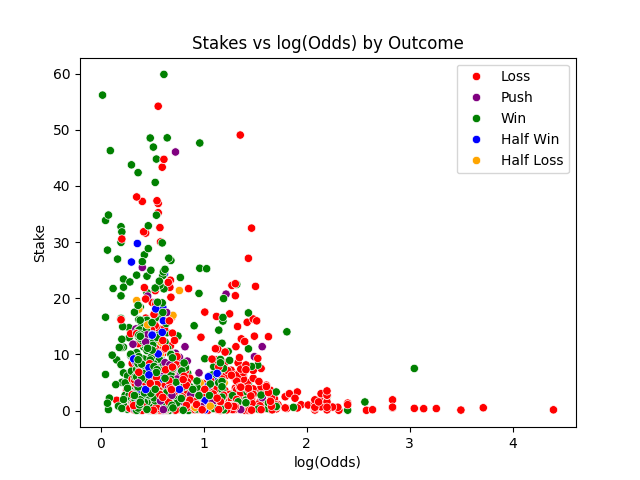
- Stakes vs. Odds Scatter Plot and Stakes vs. Log(Odds) Scatter Plot.
Results
During testing, the system proposed over 1300 sport events, and the total ROI was 6.8672%, while performing in the 50.86 percentile.
Tech Stack
- Backend: Python (modeling, ETL)
- Database: SQL (PostgreSQL)
- Frontend: React / TypeScript
- Modeling: Monte Carlo Simulation
- Algorithms: Shin Method, Kelly Criterion
- Visualization: Matplotlib / Seaborn, interactive SVGs
- Other: Git, FOOTBALLAPI